


Who is the most skilled ATP returner? – Data analysis based on TDI


In the previous article, we analyzed the serving quality of ATP players based on the TDI indicator system.
Today, let's focus on returns. This article will utilize the return indicators within the TDI system to measure and analyze who is the most proficient returner among ATP players.

Part 1: What indicators does TDI set for returns, and how do they differ from traditional return data?
In tennis, "the serve initiates the attack, while the return stands at the forefront of defense." A good return can directly neutralize the opponent's serving advantage and even turn defense into offense.
For casual viewers, the return-related data heard during matches mostly consists of simple metrics like "return win rate" and "break point conversion rate." At most, one might mention that a player "has a solid return," but it's unclear where that solidity lies—is it due to precise placement, powerful shots, accurate anticipation of the opponent's serve, or bold execution on crucial points?
Like the serving indicators, the return indicators in the TDI system completely break the limitations of traditional return data, creating a comprehensive and detailed evaluation tool for returns.
If traditional return data is a "result-only report card," then the TDI return indicators are a "detailed capability analysis report." They not only tell you "how many points a player wins on returns" but also explain "why they win points" and "where the strengths and weaknesses of their return lie." This set of indicators is suitable for professional players and coaches for training and preparation, and also helps casual viewers gain deeper insight into the tactical value of returns.
Simply put, traditional return data only tells you "who has a good return," while the TDI return indicators tell you "where their return excels and how it can be improved." This is the core value of the TDI indicator system.

Part 2: Three Major Categories of Core Return Indicators, Covering "Process-Result-Strategy"
The first category is Return Quality (RSQ), which measures "how threatening this specific return shot is." This is the core of TDI's return indicators, corresponding to the Serve Quality (SSQ) indicator. It is unrelated to the outcome of the return point, focusing solely on the technical quality and threat level of the return itself. The scoring range is also 0-10; higher scores indicate a more threatening return that puts greater pressure on the opponent. This category is primarily calculated based on six core dimensions, echoing those of the Serve Quality indicator while being tailored to the characteristics of returns: return speed, spin intensity, contact point height, placement accuracy, bounce angle, and transition smoothness.
For a simple example: Both players A and B return a serve. Player A's return is fast and lands close to the line, directly pressuring the opponent. Player B's return is slow and lands shallow, allowing the opponent to easily initiate an attack. Player A's RSQ score would be significantly higher than Player B's, illustrating the gap in return quality.
The second category is Return Efficiency indicators, which measure "whether return quality translates into points won or advantage gained." These are "result-oriented" indicators, overlapping with traditional return data but more detailed and comprehensive. Their core purpose is to measure the practical utility value of returns, linking with the Return Quality indicators to explain "why some players have high return quality but low win rates" (e.g., poor follow-up after the return).
The core Return Efficiency indicators are the following five: (1) First Serve Return Win Rate: The proportion of points won when returning a first serve; higher rates indicate stronger return scoring ability. (2) Second Serve Return Win Rate: The proportion of points won when returning a second serve; higher rates indicate stronger return scoring ability. (3) Overall Return Win Rate: Calculated by combining first and second serve return win rates. (4) Return Winner Rate: The rate of what we commonly call "Return Aces." (5) Key Point Return Win Rate: The proportion of points won on returns during key point situations (game points, set points, match points, break points), reflecting return stability under pressure.

The third category is Return Tactical Distribution indicators, which measure "how a player returns and how they use returns to score points." This bridges Return Quality and Efficiency, corresponding to the Serve Tactical Distribution indicators. These indicators explain why, with similar return quality, some players win more points than others, focusing on the player's return choices and tactical variety.
The core Return Tactical Distribution indicators are the following three: (1) Return Placement Distribution: The proportion of return shots landing in different areas of the opponent's court (inside corner, outside corner, middle court, deep zone), revealing the player's tactical emphasis on returns (e.g., favoring pressure on the opponent's forehand or backhand). (2) Return Spin Type Distribution: The proportion of different spin types used on returns (topspin, sidespin, flat, slice), reflecting variation in returns; more spin variation makes it harder for opponents to predict. (3) Return Entropy: Following the same logic as Serve Entropy, it measures the unpredictability of return placement and spin. Higher entropy indicates more diverse return choices, making it harder for opponents to prepare specifically.
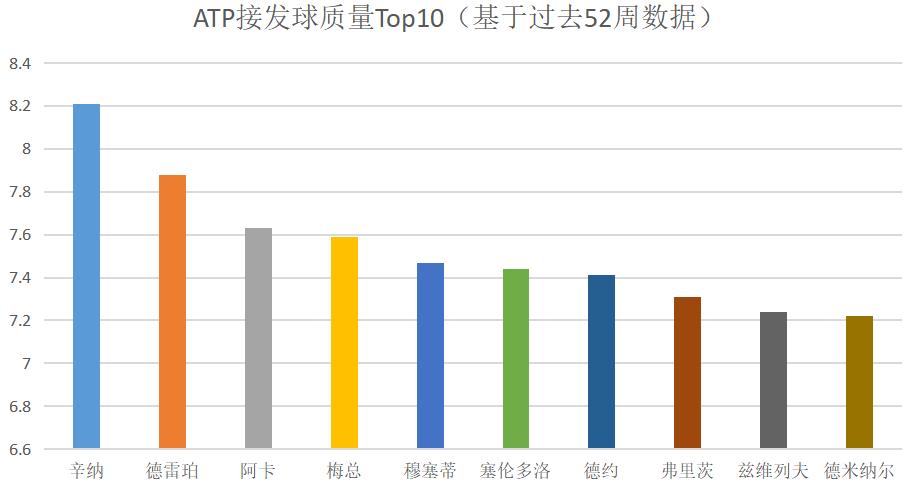
Based on these three major categories of indicators, ATP has listed the Top 10 Return Quality rankings over the past 52 weeks, as shown in the figure below.
Part 3: Comparative Analysis of Return Quality Indicators for Sinner, Alcaraz, and Djokovic
Combining ATP's publicly available data from the past 52 weeks, we again take Sinner, Djokovic, and Alcaraz as examples to compare their core return indicators, thereby summarizing the differences in their return styles.
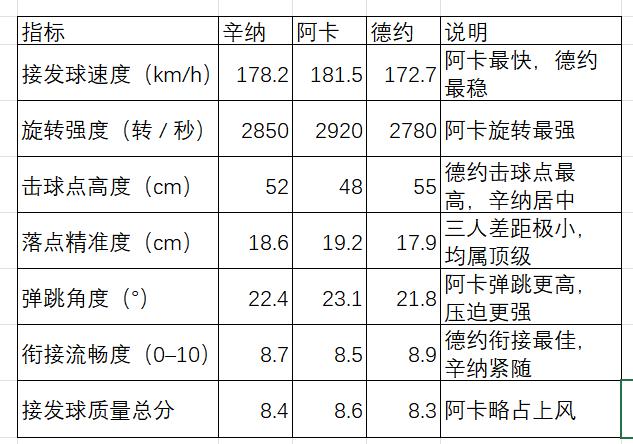
1. Return Quality Indicators
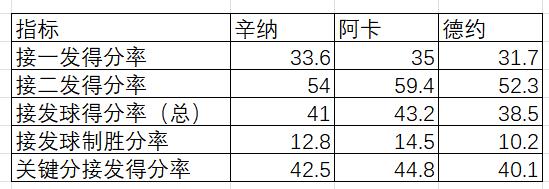
2. Return Efficiency Indicators
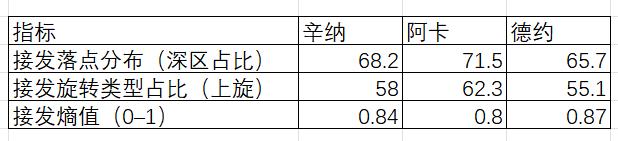
3. Return Tactical Distribution Indicators

Through these three major categories of indicators, we can analyze the return characteristics of these three players with AI assistance.
(1) Quality Dimension: Alcaraz excels in speed, spin, and bounce, achieving the highest total return quality score; Djokovic has the best transition smoothness and a higher contact point (I analyze two reasons: first, opponents' serves bounce higher; second, Djokovic returns the opponent's serve earlier), showing stronger stability; Sinner is intermediate, with outstanding balance.
(2) Efficiency Dimension: Alcaraz leads in both first serve and second serve return win rates, being the most efficient returner among the three; Sinner closely follows in first serve return win rate and maintains stable second serve return win rate; Djokovic's overall win rate is slightly lower, and his performance on key points is also slightly lower.
(3) Tactical Dimension: Alcaraz has the highest proportion of deep zone returns and topspin usage, showing the strongest tactical aggression; Djokovic has the highest entropy, indicating the most tactical variation and being hardest to predict; Sinner is balanced, with precise control over placement and spin.(Source: Tennis Home Author: Yun Juan Yun Shu)

 Links
Links
 Contact
Address:UNIT 1804 SOUTH BANK TOWER, 55 UPPER GROUND,LONDON ENGLAND SE1 9E
Number:+85259695367
E-mali:[email protected]
 App
App